
Equinor’s shapely curves

Everything – from the start-up of and eventual declining output from the first giant fields, via internationalisation, mergers and the transition to mature petroleum provinces, to bringing Johan Sverdrup on stream as the latest giant – can be presented in graphs showing aspects of Equinor’s production from 1979 to 2020.
Liquids off Norway
Oil and condensate are often grouped collectively as “liquids”.[REMOVE]Fotnote: In addition to oil, liquids production includes condensate – light hydrocarbons which condense as liquid and are also known as natural gas liquids (NGL). The company’s first liquids production came from Statfjord in 1979, where Mobil was operator until 1 January 1987. Oil output increased steadily until 1996, mostly from Statfjord (peak year, 1987), Gullfaks (on stream 1986, peak year 1994) and Oseberg (on stream 1988, plateau 1993-97). Statoil had big interests in these fields.
Ranked as the biggest oil field on the Norwegian continental shelf (NCS), Statfjord reached plateau production in 1986-94 and has set the following “records”.[REMOVE]Fotnote: Kyrre Nese by e-mail, 8 August 2022.
- Best day: 16 January 1987, 850 204 barrels of oil per day (b/d)
- Best week: week 45, 1986, 838 263 b/d
- Best month: November 1986, 811 587 b/d
- Best year: 1987, 720 449 b/d
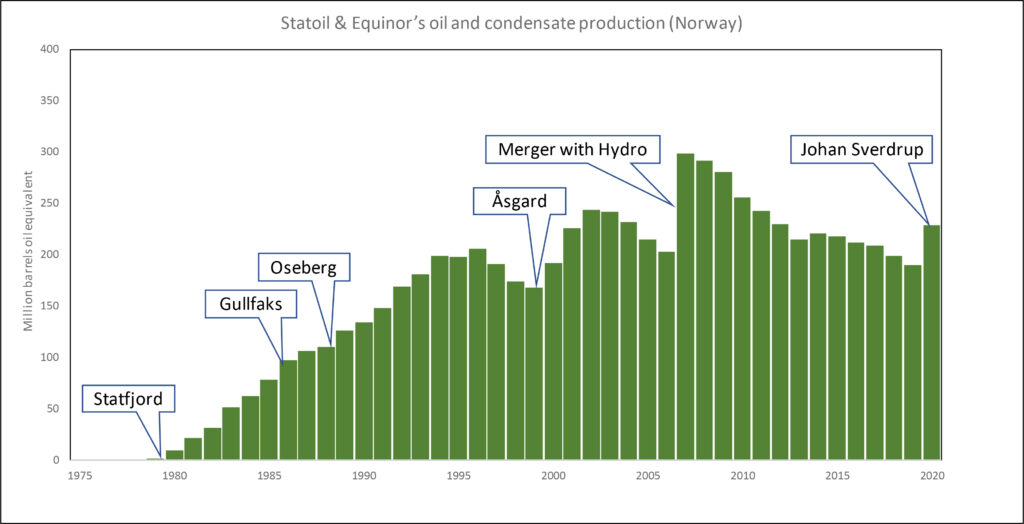
After three years of declining output in 1997-99, starting up the Åsgard field on the Halten Bank in the Norwegian Sea during 1999 and acquiring part of Saga Petroleum again lifted Statoil’s liquids production in 2000-02. But a new downturn then persisted until 2007.
In that year, the merger with Hydro’s oil and energy division lifted the curve before it resumed a steady decline until 2019. A further visible rise occurred in 2020, when Johan Sverdrup had its first full year on stream. According to Equinor, phase II of this development is set to deliver 720 000 b/d from 2022 – giving the curve yet another upward trend.
Gas in Norway
Equinor’s first gas arrived in 1979, the same year it began producing oil. It came from the Frigg field in the North Sea, where Elf was operator and Statoil a licensee. When the Statpipe pipeline became operational in September 1985, gas from Statfjord was not longer injected into the reservoir but could be transported to Kårstø north of Stavanger and thereby increase Statoil’s output of this commodity.
Equinor is operator for both oil and gas production from Troll, Norway’s largest petroleum field. Statoil originally operated only the gas output, which began in 1996, with Hydro responsible for producing the oil. Although Troll gas can be seen on the curve, it was not initially as dominant as one might think. That reflected partly the time required for production to reach its plateau level, and partly Statoil’s relatively modest equity share of the field at start-up. It held only about 10 per cent, with the state’s direct financial interest (SDFI) as by far the largest licensee.
In connection with its partial privatisation in 2001, Statoil was able to acquire a slice of the SDFI and thereby raise its equity stake in the Troll Unit to about 20 per cent. That can be seen in a marked increase in the gas production curve.
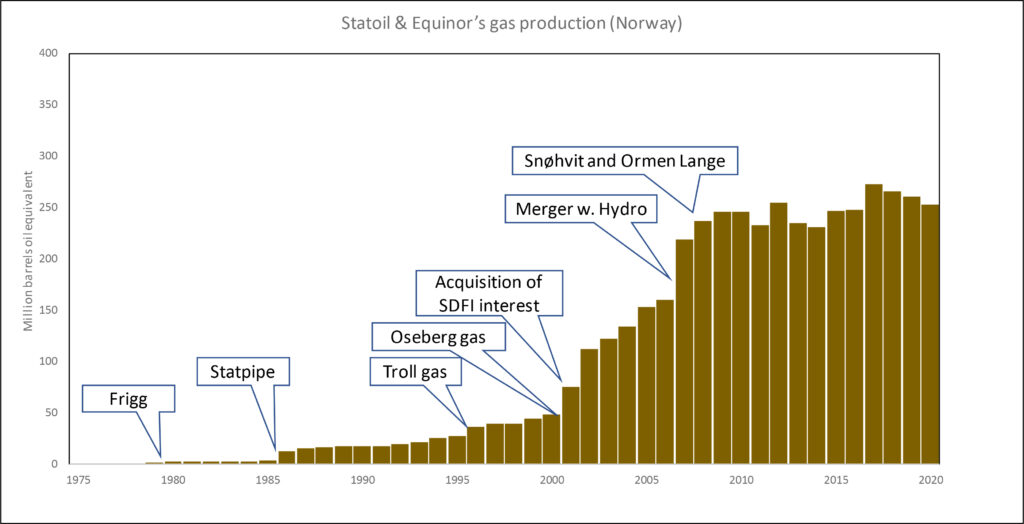
Oseberg in the North Sea began producing gas in 2000, after 12 years of pure oil output. Statoil’s partial takeover of Saga assets in the same year can additionally be seen in the rising output curve.
By 2002, Åsgard gas production was in full flow, and Statoil’s overall output more than doubled in just two years.
Gas production increased steadily until 2007, when the Hydro merger produced another marked jump in the curve. Troll accounted for a substantial part of this rise.
A further increase occurred in 2008, the first full producing year from the big Snøhvit and Ormen Lange gas fields in the Barents and Norwegian Seas respectively. Production has since been more or less unchanged.
Liquids internationally
Ignoring the Statfjord, Frigg and Murchison fields, which crossed into the UK North Sea sector, Statoil’s first liquids production outside Norway came from the Dutch Kotter field in 1984. Along with Britain’s Victor field and some amounts from Thailand’s Bongkot field, its international oil output was modest.
The Azeri Chirag Guneshli complex in the Caspian came on stream in 1997. Although Statoil’s stake in these fields was only 8.56 per cent, their output is detectable in the curve – not least in the peak production years around 2010.
Oil began to flow in 2001 from Angola, where the company was a partner. Although problems have arisen in connection with the company’s involvement in this west African country, developments there have been among its more rewarding international projects.
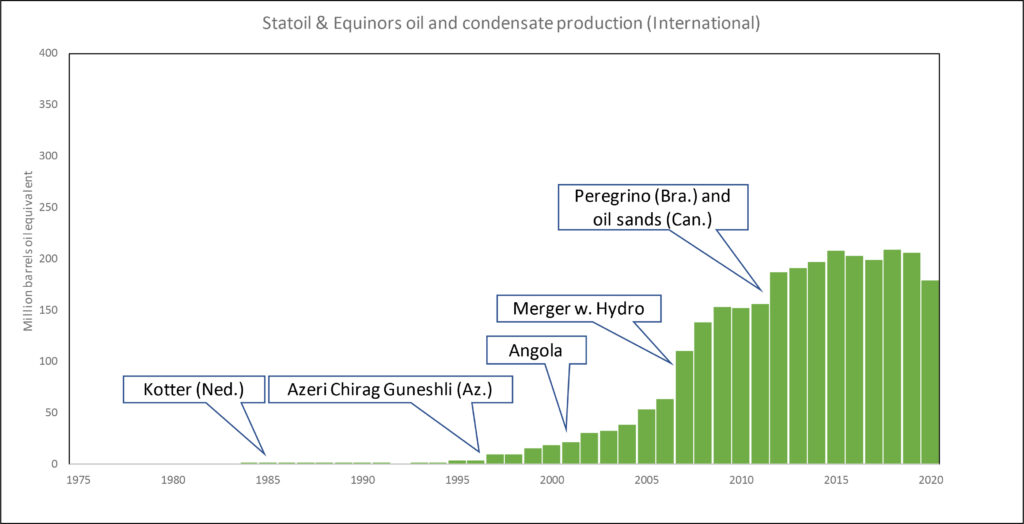
The next marked upward jump came with the 2007 merger, when the company secured Hydro’s international petroleum portfolio. That made it “the world’s largest operator in water depths beyond 100 metres.[REMOVE]Fotnote: Annual report, 2006, Statoil: 4.
Oil production began in both Brazil, from the Peregrino field, and Canada’s oil sands in 2011. The following year, with these developments well under way, international liquids output rose by 30 per cent. At the same time, Statoil farmed into the Bakken and Three Forks “tight oil” areas in the USA and thereby further increased production. However, the company disposed of its holdings in oil sands in 2017, and international liquids output has since been slowly declining.
Gas internationally
Gas fields outside Norway have accounted for a very small share of Statoil/Equinor’s overall production. This proportion has been steadily rising since 2004, and amounted to just over 10 per cent in 2020. The great bulk relates to US shale gas, where Statoil first became involved in 2008 through the Marcellus field, Algeria’s In Salah field and Shah Deniz in Azerbaijan’s sector of the Caspian.
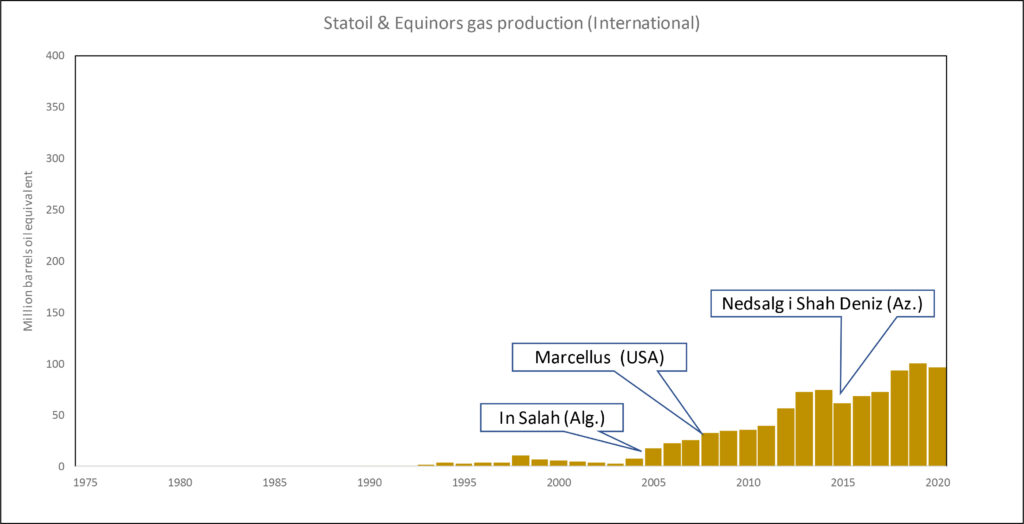
Output from Marcellus has grown steadily as a result of technological advances in land-based gas production from tight rocks, and accounts for the lion’s share of the increase since 2011. Statoil reduced its stake in Shah Deniz by 15.5 per cent in 2015, which had a visible effect on the production curve.
Equinor and the NCS
The NCS and Equinor can be said to have developed by and large in parallel. Historically, the company has accounted on average for 22 per cent of Norwegian offshore production. When Statfjord came on stream in 1979, this proportion jumped from zero to more than 20 per cent in line with that field’s production profile. At times, Statfjord was responsible for more than 50 per cent of Norwegian oil production.
After this field went off plateau and a number of other discoveries with a smaller or no Statoil holding came on stream, the company’s share of overall Norwegian output declined. It increased markedly again following the partial privatisation and the acquisition of SDFI holdings. The company’s percentage share of NCS production naturally also rose.
A further increase occurred after the 2007 merger, raising Statoil’s share to a third of total output. This remained roughly unchanged until 2020. If Equinor’s international holdings are included, its production has averaged 28 per cent of overall NCS output and has largely been over 50 per cent since 2010.
It is worth noting that Norway shifted in the 2000s from being an oil nation in terms of volume to becoming primarily a gas supplier. Equinor, on the other hand, produces more oil than gas.


-10 copy")
-12")
By and large, the company’s production curve has followed the trend on the NCS. Since the early 2lst century, however, this curve has been rather flatter than for overall Norwegian production, which is in decline. That is because Equinor is not one of the larger licensees in former giant fields such as Ekofisk and Valhall, where production is falling. But it has substantial holdings in several developments which have not reached tail production, such as Åsgard, Snøhvit and Ormen Lange.
Equinor produced 15.5 billion barrels of oil equivalent (boe) between 1979 and 2020, with gas accounting for a third and liquids for two-thirds. This is sufficient to meet total world oil consumption for 155 days, or roughly the same as the whole of Ekofisk, Statfjord, Oseberg and Johan Sverdrup – the four NCS fields which rank immediately after Troll in size terms. Milestones passed along the way include the following.
- 1991: cumulative production exceeds one billion boe
- 2002: daily production exceeds one million boe
- 2005: cumulative production exceeds five billion boe
- 2012: daily production exceeds two million boe
- 2013: cumulative production exceeds 10 billion barrels.
Production is set to rise somewhat for both Equinor and the NCS as a whole over the next few years, with the second phase of the Johan Sverdrup development coming on stream. In the medium and long term, however, output should decline markedly. How quickly that will happen depends on demand, resource growth through new discoveries, and technological development to improve oil/gas recovery.
The international backdrop. The Seven Sisters and Opecarrow_forward